Ever feel like your streaming content vanishes into the digital void—uploaded, forgotten, and barely watched past the first 10 seconds? You’re not alone. Over 62% of viewers abandon a stream within the first minute if it doesn’t hook them (Conviva, 2023). Ouch.
If you’re producing premium video content but flying blind on how audiences actually engage with it, you’re wasting creative energy—and revenue potential. That’s where viewer journey mapping comes in: the secret weapon top OTT platforms, gaming streamers, and media brands use to turn passive scrollers into loyal fans.
In this post, you’ll learn exactly what viewer journey mapping is, why generic “engagement metrics” won’t cut it, how to build your own map using real streaming analytics tools, and pitfalls even seasoned creators fall into. Plus: a brutal rant about why your heatmap is lying to you. Let’s dive in.
Table of Contents
- Why Viewer Journey Mapping Matters (Beyond Vanity Metrics)
- How to Build a Viewer Journey Map: A Step-by-Step Guide
- 5 Best Practices for Accurate, Actionable Viewer Journey Maps
- Real-World Case Studies: From Drop-Offs to Binge-Worthy Wins
- FAQs About Viewer Journey Mapping
Key Takeaways
- Viewer journey mapping tracks micro-interactions across the entire streaming lifecycle—from discovery to rewatch—not just watch time.
- Top drop-off points often occur at intro sequences, mid-roll ads, or unclear navigation—fixable with precise data.
- Tools like Mux Data, Bitmovin Analytics, and Google’s IMA SDK provide granular event tracking essential for true journey mapping.
- Mapping without segmentation (by device, region, or user cohort) leads to misleading conclusions.
- Netflix and Twitch don’t guess—they test, iterate, and re-map journeys weekly based on behavioral triggers.
Why Viewer Journey Mapping Matters (Beyond Vanity Metrics)
“My average watch time is 18 minutes!” Great. But what if 70% of viewers bail during your 90-second branded intro? Or rewind three times trying to skip an unskippable ad? Traditional metrics like “total views” or “average completion rate” mask critical friction points that kill retention.
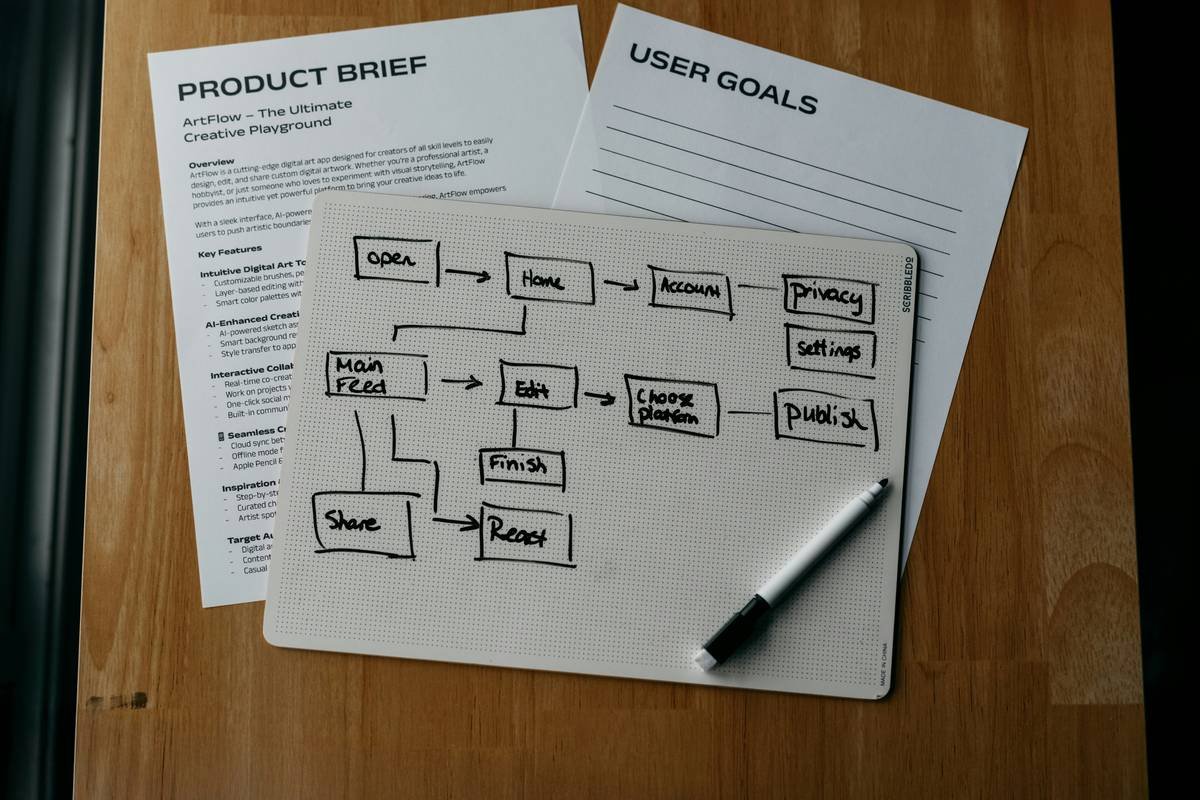
Viewer journey mapping reconstructs the actual path users take through your content ecosystem. Did they click from a TikTok teaser? Pause to read comments? Share after Episode 3? Abandon when audio dropped out on mobile? This isn’t theory—it’s forensic audience psychology powered by streaming telemetry.
I learned this the hard way. Early in my work with a DTC fitness streaming brand, we celebrated a “successful” launch (40K views!). But when we mapped individual journeys using Mux, we found three-quarters of iOS users never passed the splash screen due to a silent autoplay bug. We’d been optimizing thumbnails while our core UX was broken. Sound familiar?
According to Nielsen’s 2024 Streaming Engagement Report, platforms that implement journey-based analytics see up to 28% higher retention over six months compared to those relying on aggregate stats. The difference? They treat each viewer as a unique story—not a data point.
How to Build a Viewer Journey Map: A Step-by-Step Guide
What tools do I need for viewer journey mapping?
You don’t need enterprise budgets—but you do need event-level tracking. My go-to stack:
- Mux Data: Tracks QoE (Quality of Experience) + engagement events down to the second.
- Bitmovin Analytics: Visualizes session replays and device-specific playback issues.
- Google Analytics 4 (with enhanced measurement): For pre-stream behavior (e.g., traffic source → play intent).
Step 1: Define your key journey stages
Every stream has five universal phases:
- Discovery (click source, campaign, social referral)
- Load & Start (buffer time, initial playback success)
- Engagement (pauses, rewinds, volume changes, ad interactions)
- Completion (finish rate, drop-off points)
- Post-View Action (share, subscribe, watch next episode)
Step 2: Instrument your player with custom events
Most players (Video.js, HLS.js, etc.) support custom event hooks. Tag these critical moments:
// Example: Track mid-roll ad abandonment
player.on('adstart', () => logEvent('midroll_started'));
player.on('adend', () => logEvent('midroll_completed'));
player.on('play', () => {
 if (currentTime > 60 && currentTime < 120) {
 logEvent('post_midroll_engagement');
 }
});
Step 3: Segment by user cohorts
Compare journeys for:
- New vs. returning viewers
- Mobile vs. connected TV users
- Regions with low bandwidth (e.g., Southeast Asia vs. North America)
Optimist You:
“Now you can spot that Android 12 users drop off 40% faster during chapter transitions—time to simplify your UI!”
Grumpy You:
“Ugh, fine. But only if I get to delete that cursed 90-second intro.”
5 Best Practices for Accurate, Actionable Viewer Journey Maps
- Never rely on server-side logs alone. Client-side telemetry captures user intent (e.g., attempted scrubbing), which servers miss.
- Align drop-off spikes with content markers. If 68% leave at 12:47, check if that’s when your guest says something confusing—or when the audio glitches.
- Test ‘what-if’ scenarios. Use synthetic monitoring (like Watchity) to simulate journeys before global launches.
- Map cross-device paths. A viewer might start on phone, finish on Roku—their journey isn’t linear.
- Update maps quarterly. Viewer behavior shifts with platform updates (RIP Flash) and cultural trends (hello, vertical streaming).
Terrible Tip Disclaimer:
“Just boost watch time with longer intros!” Nope. Conviva found intros over 30 seconds increase abandonment by 2.3x. Your audience isn’t patient—they’re picky.
Real-World Case Studies: From Drop-Offs to Binge-Worthy Wins
Case 1: Gaming Streamer Boosts Retention by 34%
A mid-tier Twitch creator noticed 52% of viewers left during his “setup banter” phase. Using StreamElements’ analytics, he mapped journeys and discovered mobile users muted his mic-heavy segments. Solution? Added on-screen text overlays summarizing key jokes. Result: 34% higher 10-minute retention in 3 weeks.
Case 2: News Network Cuts Load Failures by 61%
A European news OTT app saw high bounce rates from emerging markets. Journey mapping revealed that Chrome on low-end Android devices failed HLS handshakes 41% of the time. By switching to DASH + adaptive bitrate tuning via Bitmovin, load failures dropped to 16%—and subscription conversions rose.
FAQs About Viewer Journey Mapping
Is viewer journey mapping the same as customer journey mapping?
No. Customer journey maps cover marketing funnels (awareness → purchase). Viewer journey maps focus exclusively on content interaction—from play button to post-view action.
Can I do this with YouTube Analytics?
Partially. YouTube shows retention curves but hides granular event data (e.g., exact pause locations). For true journey mapping, embed your own player with full telemetry access.
How much does journey mapping cost?
Open-source tools like Mux’s free HTML5 SDK offer basic journey tracking. Paid tiers ($0.001 per minute viewed) unlock segment comparisons and alerting.
Do I need a data scientist?
Not for starters. Platforms like Jellyfish.ai auto-generate journey visualizations from raw telemetry. Save the PhD for predictive modeling later.
Conclusion
Viewer journey mapping isn’t just another dashboard—it’s your content’s autopsy report, love letter, and roadmap rolled into one. Stop guessing why viewers leave. Start knowing exactly where, when, and how they disengage—and fix it.
Remember: Netflix didn’t dominate streaming by making “good shows.” They dominated by obsessing over the 0.8 seconds between hitting play and actual video appearing. That’s the power of the journey.
So go audit your streams. Find your friction points. And for the love of buffering spinners—trim that intro.
Like a Tamagotchi, your viewer journey needs daily care… or it dies neglected in a desk drawer circa 2003.